MAPuTelemetry overlay for action cams Early access

Widgets

74 ready-made widgets in 13 categories. You can make your own too: set one up (data, colours, size, labels), then "Save as New Widget" — in the widget's right-click menu or in the editor — puts it into the gallery's "Custom" category under your own name.

Rides, set up

Freely licensed photos with the data of real recorded rides on them; the pictures are exported by MAPu.

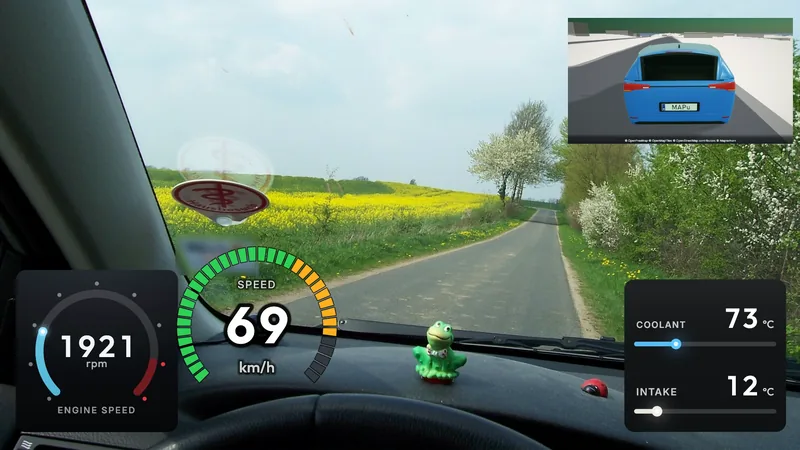
A photo through a car's windscreen onto a country road beside a rapeseed field and blossoming trees; on the dashboard engine speed (1921 rpm), a segment speedometer (69 km/h), coolant (73 °C) and intake air (12 °C), the blue 3D car on the map from behind top right.
Photo: Susannesonja, public domain · cropped, some lettering blurred, widgets added

Road trip, through the windscreen

On the picture:

  • Rev counter (digital display)
  • Speed ring
  • Temperatures (digital display)
  • 3D vehicle on the map
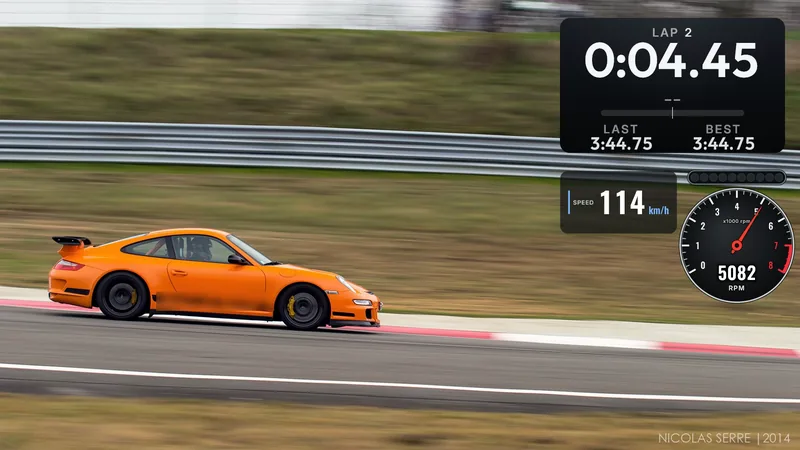
A photo of an orange sports car on a race circuit; lap time top right (lap 2, 0:04.45, last and best 3:44.75), speed (114 km/h) and a race rev counter with shift lights (5082 rpm) below it.
Photo: Nicolas Serre, CC BY 2.0 · cropped, some lettering blurred, widgets added

Track day

On the picture:

  • Lap time (digital display)
  • Digital Speed
  • Rev counter (race)
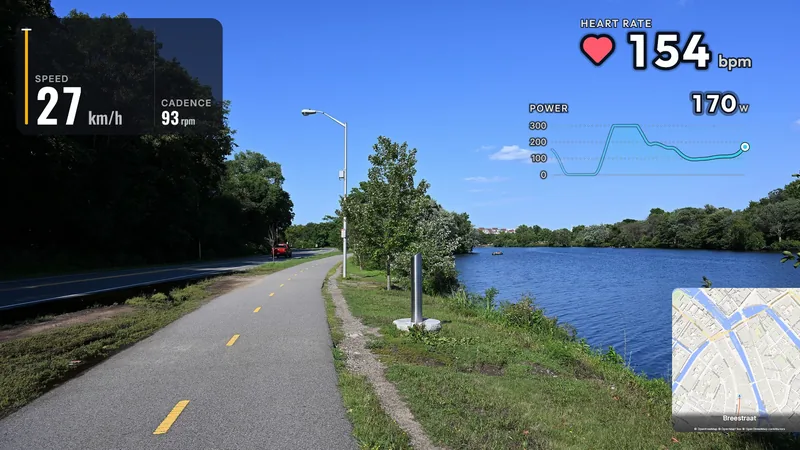
A photo of a riverside bike path under a blue sky; a data panel with speed (27 km/h) and cadence (93 rpm) top left, heart rate (154 bpm) with a heart and a power graph (170 W) top right, a small street map bottom right.
Photo: 4300streetcar, CC BY 4.0 · cropped, widgets added

Road cycling

On the picture:

  • Data Panel
  • Heart rate
  • Graph
  • Map
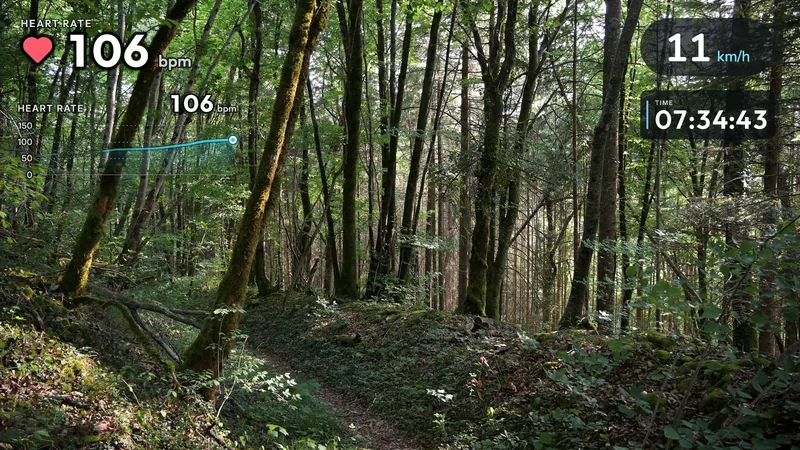
A photo of a forest trail among tall trees; heart rate (106 bpm) and its graph top left, speed (11 km/h) and the time of day (07:34:43) top right.
Photo: DimiTalen, CC0 · cropped, widgets added

Trail running

On the picture:

  • Heart rate
  • Graph
  • Speed (Pill)
  • Time / clock
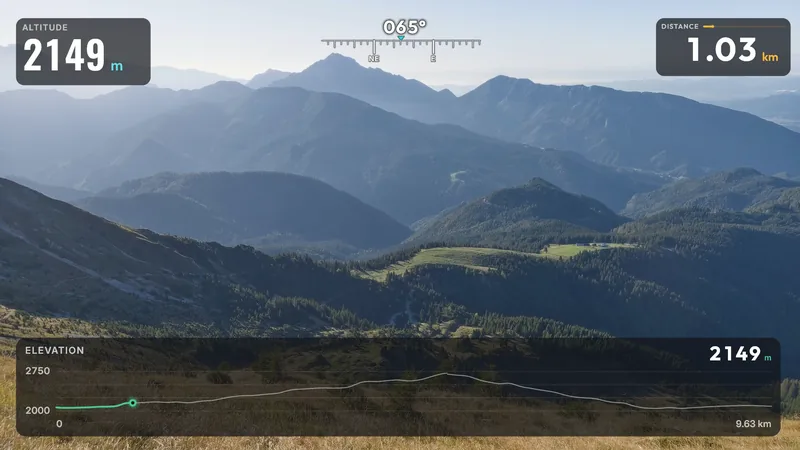
A photo of a mountainside with hazy ranges behind; altitude (2149 m) top left, a compass tape at 065° top centre, distance (1.03 km) top right, the elevation profile of the whole hike between 2000 and 2750 m at the bottom, the marker near its start.
Photo: Ajznponar, CC0 · cropped, widgets added

Mountain hike

On the picture:

  • Altitude
  • Compass (HUD strip)
  • Distance Traveled
  • Elevation Profile
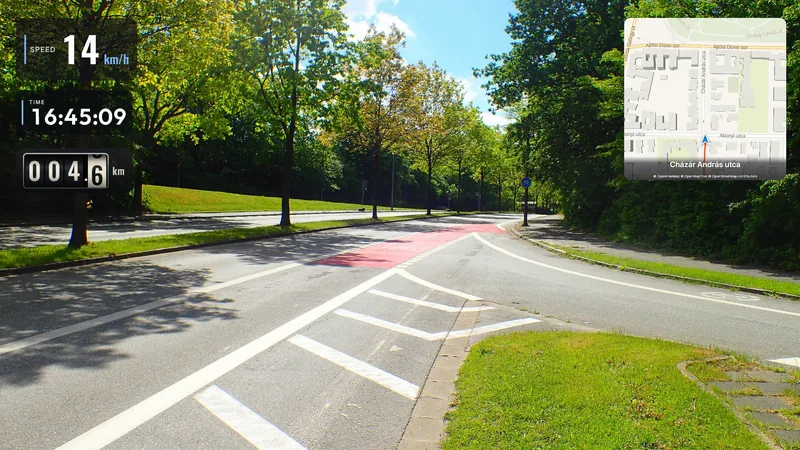
A photo of a city road with a red cycle lane and a row of trees; speed (14 km/h), time (16:45:09) and a drum odometer (4.6 km) top left, a street map with street names and the position arrow top right.
Photo: Gmbo 2013, CC0 · cropped, widgets added

E-scooter in the city

On the picture:

  • Digital Speed
  • Time / clock
  • Map
  • Odometer

3D vehicles

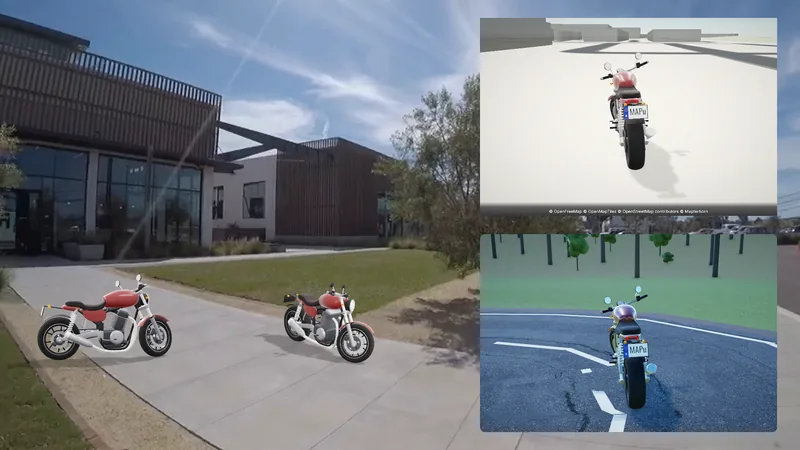
An exported frame with the built-in red motorbike in four 3D widgets: from the side and from the front at an angle on the pavement at the bottom left, from behind on the 3D map top right, from behind on the 3D scene's road bottom right.
The four 3D widgets with the built-in motorbike: fixed view, live 3D vehicle, 3D vehicle on the map, live 3D scene.
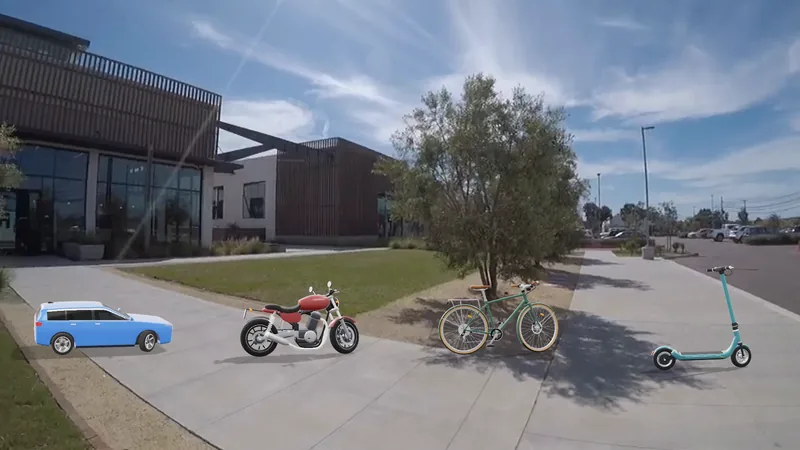
An exported frame: the four built-in 3D vehicles side by side on the pavement — a blue car, a red motorbike, a green bicycle and a turquoise e-scooter.
The four built-in vehicles in the fixed-view 3D widget.

Every widget by category

Speed 4

  • HUD (Speed + Heading)
  • Speed Graph
  • Speed Heatmap (Bead String)
  • Speed Heatmap (Track)

Heading 3

  • Compass (HUD strip)
  • Compass Dial
  • Heading Dial

Altitude/terrain 4

  • Altitude
  • Climb
  • Elevation Profile
  • Slope Gauge

Time 4

  • Clock (header row)
  • Date & Clock
  • Lap Timer
  • Time / clock

Distance 6

  • Distance Traveled
  • Journey Line
  • Kilometer Ladder
  • Milestone Flash
  • Odometer
  • Progress Bar

Map 7

  • 3D vehicle on the map
  • Following Route
  • GPS coordinates
  • Map
  • Map 3D
  • Route
  • Route Trace

Forces 2

  • G-Force
  • Lean Indicator

Sensors 1

  • Heart rate

GPS status 3

  • GPS reception
  • GPS status
  • GPS timeline

Ride summary 5

  • Bottom bar
  • Ride DNA Bars
  • Ride DNA Ring
  • Ride DNA Strip
  • Trip Stats

Any data 12

  • Bar
  • Data Panel
  • Gauge
  • Graph
  • Needle gauge
  • Pill number
  • Profile
  • Segment ring
  • Strip
  • Tape
  • Value
  • Value card

Vehicle 19

  • 3D vehicle on the map
  • Gear (digital display)
  • Gearbox (H-gate)
  • Lap time (digital display)
  • Lap time (stopwatch)
  • Line-art figure
  • Live 3D scene
  • Live 3D vehicle
  • Live 3D vehicle (fixed view)
  • Pedals
  • Pedals (digital display)
  • Rev counter (digital display)
  • Rev counter (race)
  • Sector ring (drawn instrument)
  • Sector times (digital display)
  • Steering angle (digital display)
  • Steering wheel
  • Temperature gauges (drawn instruments)
  • Temperatures (digital display)

Other 5

  • Logo / image
  • Rear camera
  • Text
  • Text / caption
  • Timed List

The gallery also holds 8 ready-made speed variants next to them (82 cards in all). 3D vehicle on the map appears in two categories. A widget can also be made from a file: one file in your widget folder (Help → Making your own widget). The count above does not include those.